Abundance via point-transects distance-sampling (point counts) when detection depends on covariates.
Loading required package: units
udunits database from C:/Users/trent/AppData/Local/R/win-library/4.5/units/share/udunits/udunits2.xml
data(thrasherDf)
oneHectare <- units::set_units(1, "ha")
dfuncFit <- thrasherDf |>
  dfuncEstim(dist ~ bare + shrub + groupsize(groupsize)
             , likelihood = "hazrate") |>
  abundEstim(area = oneHectare
             , ci = NULL)
summary(dfuncFit)
Call: dfuncEstim(data = thrasherDf, dist ~ bare + shrub +
   groupsize(groupsize), likelihood = "hazrate")
Coefficients:
             Estimate      SE          z           p(>|z|)
(Intercept)   6.256097544  0.94375974   6.6289091  3.381767e-11
bare         -0.002688512  0.01106188  -0.2430429  8.079722e-01
shrub        -0.076018161  0.02869760  -2.6489382  8.074510e-03
k             4.412968498  0.43682868  10.1022865  5.396891e-24

Message: Success; Asymptotic SE's
Function: HAZRATE
Strip: 0 [m] to 265 [m]
Average effective detection radius (EDR): 121.0084 [m] (range 83.04405 [m] to 158.5773 [m])
Average probability of detection: 0.2115124 (range 0.09820311 to 0.3580883)
Scaling: g(0 [m]) = 1
Log likelihood: -994.7568
AICc: 1997.726

     Surveyed Units: 120
   Individuals seen: 196 in 193 groups
 Average group size: 1.015544
   Group size range: 1 to 2
Density in sampled area: 3.704369e-05 [1/m^2]
Abundance in 10000 [m^2] study area: 0.3704369
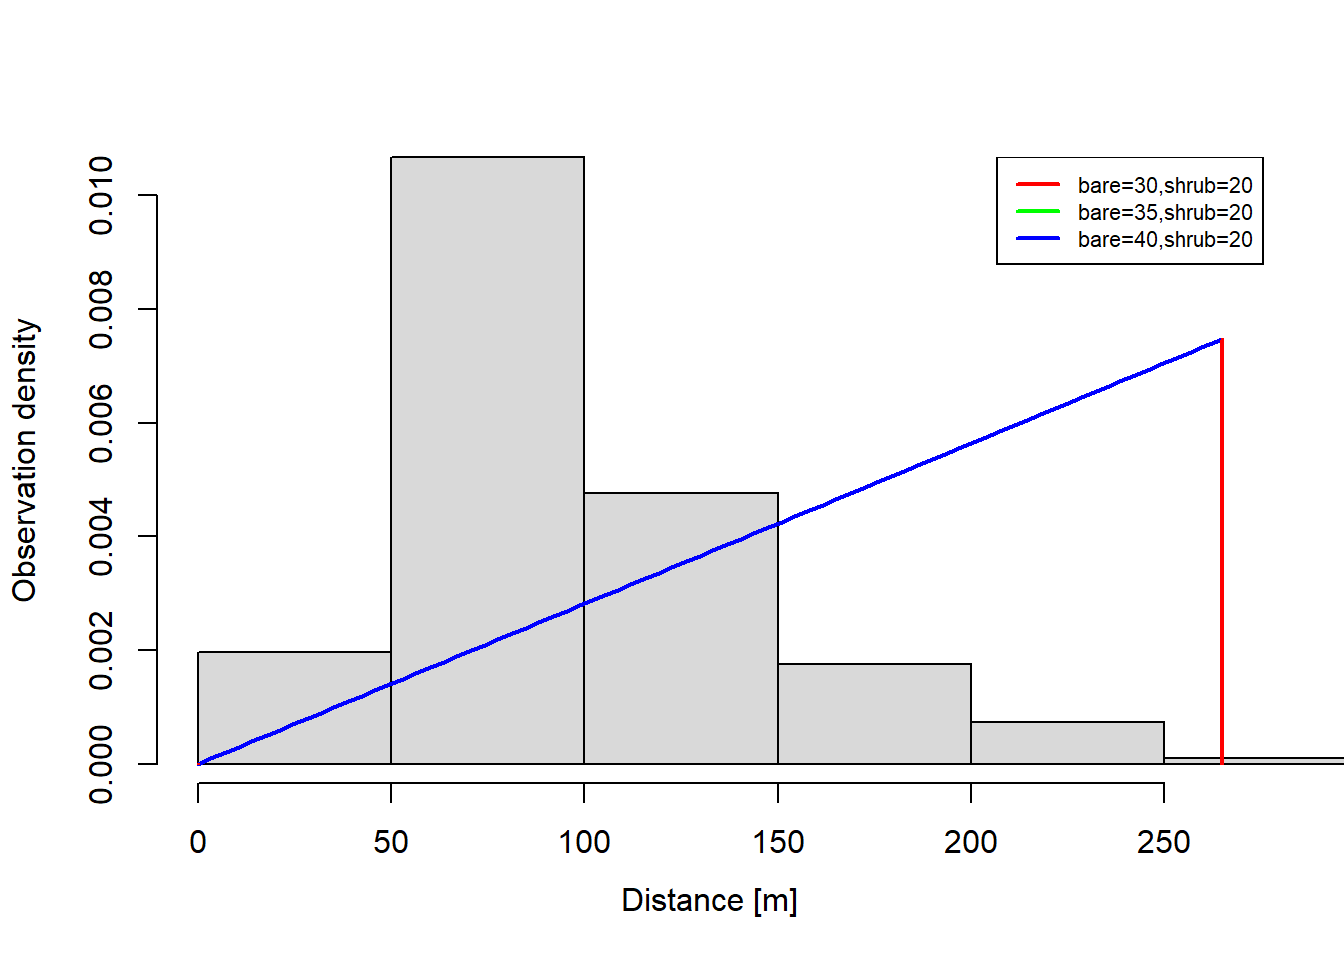
plot(dfuncFit
     , newdata = data.frame(bare = c(30, 35, 40)
                            , shrub = 20)
     , lty = 1)